Walkshed uses an advanced methodology to calculate and map walkability. It is the personal research project of Aaron Ogle, a software developer at Azavea in Philadelphia, PA.
While living in Seattle, Aaron became intrigued by Alan Durning of the Sightline Institute and his concept of a "walkshed" that would score a location based on the quantity and diversity of amenities within a one-mile radius. A year later, Walk Score, which drew heavily from Durning's walkshed concept, became the first application to calculate walkability. Walk Score is a fantastic application with a clever methodology but it also has a number of acknowledged limitations.
Aaron wondered if improvements were possible. So as part of Azavea's 10% research project program, he has developed Walkshed Philadelphia and now Walkshed NY to demonstrate that it is possible to more accurately calculate and map walkability.
Actual Walking Distances
It’s not very helpful to calculate walkability based on amenities that you can’t actually walk to. Many communities are close to amenities “as a crow flies” but those amenities are cut off from pedestrians by barriers and disconnected street networks. Walkshed works by using "friction-based" (aka "cost-based") distance calculations in lieu of straight-line distances for the best accuracy.
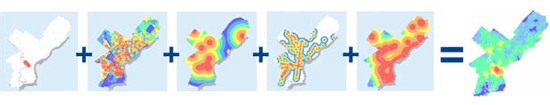
Walkshed friction calculations work by laying a grid of hundreds of thousands of cells over the entire city and determining how much “friction” a pedestrian would encounter for each cell. For example, cells on interstates and rivers have very high walking friction while cells on the street grid and parks have very low friction.
This has important effects on walkability. 1) Barriers will have a negative impact on walking distances since people typically don’t walk through highways or on water. 2) Street connectivity matters. Cul-de-sacs and winding suburban streets will have longer walking distances than an urban street grid.
By determining the walking friction of the entire city, we can calculate the optimal and actual walking distance from every point in the city to the closest amenity in every category.
Ample Decision Factors
It’s difficult to make a good decision without all of the information. Drawing from several data sources, including the city governments, Bing, and InfoUSA, and now NYC Data Mine , Walkshed includes a wide array of decision factors in its walkability calculations. More data enables more useful calculations. Some of our favorites include rail stops, farmer’s markets, grocery stores, bars, subway stops, and Wifi hotspots.
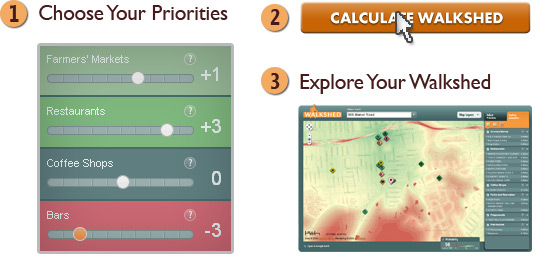
Your Preferences
Walkability means different things to different people. Empty nesters may enjoy being near a wide variety of restaurants and theaters. Runners and families might prefer easy access to parks and playgrounds. Young professionals and students may like the nightlife in certain neighborhoods. All of these people love and value walkability, but they all have different preferences that shape it.
Using Azavea’s DecisionTree calculation engine, Walkshed is able to dynamically account for each person’s preferences by giving relative weights to each factor before combining the data. This means that giving a +1 to everything is no different than giving everything a +5 since there is no difference from factor to factor. This also means that a +2 is twice as important than a +1, a +3 is 1.5 times more important than a +2, and so on.
Read our Terms of Service and Privacy Agreement
NYC Photo Credit / Philly Photo Credit
Your 60 Billion Walkability Maps
You heard right, we said 60 billion custom walkability maps for each NYC resident. Walkshed NYC contains 17 preferences each of which can be set to 11 values—that's 505,447,028,499,293,771 possible maps that you can select from. Plenty of possibilities for all 8,363,710 NYC residents.
The complexity only begins there. Each of the 17 walkability preferences are made up of 157,715,256 values arranged in a grid to cover the city. The values in your selected preferences need to be combined on the fly to generate your distinct map.
What powers this immense calculation? DecisionTree.
DecisionTree is a set of web-based planning and prioritization tools. It is able to prioritize locations based on custom weighted geographic preferences. Based on its calculations, DecisionTree generates a "hot spot" or "heat" map displaying the locations that best match users' selected preferences and weights.
Calculating custom weighted preferences quickly is the real challenge. Distributed computing enables DecisionTree to optimize the speed with which results are delivered. As you might imagine, performing these calculations is a processor-intensive operation, given that the data sets in question are frequently comprised of thousands or even millions of cells. Additionally, the web-based nature of DecisionTree demands that results be delivered to end users in a timely fashion. To this end, Azavea has exploited the nature of weighted overlay operations to develop a distributed processing methodology that optimizes resources by spreading the computing workload among multiple threads and machines.
The result is a graphical representation of spatial data, where values are represented as colors along a spectrum—a heatmap. For example, areas that best meet a user's defined priorities may be colored green, while poorly suitable areas are shaded red. Heat maps present complex quantitative and spatial information in a form that is easy to understand without technical skills.
DecisionTree isn't just about walkability. Organizations, businesses, and government agencies regularly need to weight multiple geographic decision factors to identify optimal locations for their activities. What do you want to prioritize geographically? Contact us at [email protected]
Learn more about DecisionTree and how it might be used.
What is Walkshed?
Walkshed is a web application that uses an advanced methodology to calculate and map walkability.
Who made Walkshed?
Walkshed is the personal research project of Aaron Ogle, a software developer at Azavea in Philadelphia, PA. You can follow Aaron on Twitter (@atogle).
Special thanks also go to Jeff Adams and Josh Marcus for work on the DecisionTree calculation engine and API, Robert Cheetham for help with map algebra, Brian Jacobs for web site design, Dana Bauer for assembling many of the data layers, Andrew Jennings for systems administration, Jeremy Heffner for performance enhancements, and several others for help with assembling data sets and testing. These people are all rock stars.
How does Walkshed work?
Walkshed works by combining actual walking distances with ample decision factors and your preferences. You can read all of the details here.
How is Walkshed different from Walk Score?
Walkshed and Walk Score do very similar things but ultimately have different goals. Walk Score is trying to provide a basic walkability metric to as many people as possible to aid in the home-buying process. Walkshed, on the other hand, seeks to be the gold-standard walkability calculation engine by combining accurate walking paths with numerous data sets and customizable priorities.
Can I search for a location without an address?
Yes! Hold the ALT key and click on the map within the city limits to see the walkability for that location.
This is really awesome! Can I help?
Absolutely! You can start by sharing Walkshed with your friends and family. Use Twitter or Facebook? Do you Digg? Give us a shout out! Found a bug? Send it along so we can fix it right away! Have something else in mind? Contact us and send us your thoughts.
How did you decide on your default priority set?
We decided to start with only a few priorities that we thought would be popular with most people. We’re under no illusions that it is a perfect set of priorities, but it seems like a good starting place. As Walkshed grows, we hope to gather enough data to see if any common priority trends emerge.
Where did you get your data?
Our data comes from a number of sources including city governments, the New York Data Mine, InfoUSA, Bing, and information from agency web sites.
Is Walkshed coming to my city?
We hope so! Walkshed is a very young application and we’re trying to gauge how much interest there is in this technology and its potential impact in a number of markets. But please contact us and let us know how we might expand and improve Walkshed. You can also read ideas about what the next steps for an application like Walkshed could be here: Want to Go Further
Which browsers are supported?
We only officially support IE7, IE8, Firefox 3.5, Chrome 3, and Safari 4 though you may have luck in other browsers. There are known bugs in IE6 and Opera.
I found a bug. Who do I tell?
Go to the Contact Us page and send us an email. We’ll get right on it!
Why are the amenities in my neighborhood missing or categorized incorrectly?
Unfortunately good data is really hard to come by, although municipalities working to make data more readily accessible. We understand that there are a number of errors in the data sources and are working to correct them. Thank you for your patience.
Why doesn’t Walkshed include decision factor X?
The decision factors included in Walkshed are ones that 1) we have access to the data and 2) are those we thought most impacted walkability. Have a specific factor in mind? Send it along.
How do the weights affect my walkability?
Weights affect walkability by ranking different amenities relative to one another. Do you really value proximity to rail stops but are less concerned with bars? Start by giving rail stops a +5 and bars a +2. This essentially says that rail stops are 2.5 times as important than bars. Keep this relativity in mind as you weight your factors.
Why don’t I see all of the amenities around my address?
By default, we only place markers on the map for the factors that you select to prevent the map from getting too cluttered. You can turn on any amenities you wish by clicking the checkbox beside the amenity title.
You said that you use actual walking distances in your calculations, but the distances in the amenities list are obviously “as a crow flies”. What gives?
Yes, we do use actual walking distances in calculating walkability but that data is stored in a format that is difficult to render as points. So in order to give some context to your walkability score, we draw a circle around your address and return the ten closest amenities in each category along with their approximate, straight-line distance.
Why doesn’t the walkshed layer change after I update the weights?
The walkshed layer will only update after you click the Calculate Walkshed button under the Adjust Priorities tab.
Can I turn off the walkshed layer?
Yes. You can either calculate a walkshed with zeros for every decision factor or adjust the opacity slider to 0%.
Can I change the base map layer?
Yes. Click on the Map Layers menu button and select the base map you prefer.
Can I adjust the opacity of the walkshed layer?
Yes. Click on the Map Layers menu button and adjust the opacity slider.
Can I print my walkshed?
No, we do not have a print page at this time.
How can geographic analysis tools, like Walkshed, promote a more sustainable economy and environment?
Sustainable Development does not just mean a cleaner environment; it also requires establishing local economies that are economically viable and socially responsible. It will involve a shift in mindset in terms of how we approach individual life, business, and government. And it will require the transformation of both public policy and the technologies we use to operate our community systems.
At the heart of it all is geography. Measuring a city’s walkability is just the beginning. Planning water sources, land use, optimal public transit routes, better sidewalk networks and bike lanes, traffic light timing, and distance from diverse habitats are just a few of the ways that geographic technology can help us make our towns and cities operate in a more sustainable manner.
- Where would your community start a new wind farm?
- Where should your local government invest in land preservation?
- Where are the sidewalk and bike networks in your city and how can they be made more accessible with limited funding?
- Where should a solar panel company invest to build more solar panels?
The DecisionTree software that makes Walkshed possible can help you answer these questions. It is the engine that enables users of Walkshed.org to understand which neighborhoods are most walkable based on their individual priorities. Its core value is to enable you to weight and prioritize multiple geographic decision factors to identify the best locations for specific activities.
Planning processes and public decisions often require extensive involvement by interested parties. Behaviors and policies are slow to change, but we're excited to help. What is your vision for sustainable living? We can help you make a geographic case for your community. Contact us at [email protected]
 Azavea is a boutique systems design and software development firm located in Philadelphia. What do we mean by "boutique"?
We don’t just write software, we specialize in web-based geographic analysis and modeling applications for government (local, state and federal), non-profit and academic clients.
We develop innovative, web-based software, web services and products that use mapping technologies and geography (GIS) to solve complex, interesting, and novel problems.
We have particular expertise in natural resource planning, economic development, crime analysis, real estate property analysis, and cultural resources, but are engaged in a wide range of other interesting projects.
We believe we can make a difference by promoting the emergence of more dynamic, vibrant communities through geographic information technologies. Each of our clients’ projects, products and pro bono engagements showcases this commitment.
Visit us at: http://www.azavea.com